An ML approach to Calculating Expected Value

For any subscription business, Customer lifetime value (LTV) is a powerful concept. It provides a comprehensive view of the end-to-end customer journey by incorporating factors such as average billing amount, growth, and retention trends into a single metric that allows you to make informed ROI & future revenue decisions now, without waiting months or years. But what if your subscription business has an end in sight, what if users could subscribe to multiple subscriptions, and what if subscriptions with long duration are not considered a good thing. At Udacity, our mission is to train the world’s workforce in the careers of the future, and the method of delivering on that mission has been via our Nanodegrees. Rather than trying to calculate a Customer lifetime value we’ve found a better success metric to be to predict a subscription’s Expected Value (EV).
Introduction
In this article, we’ll go into our methodology in predicting EV. But first, we’ll share some foundational context about customer flow and why we believe using EV as a Northstar metric aligns with Udacity’s mission.
Below is an overview of our customer enrollment funnel. At any given point in time, we have a number of different offers and course changes in flight to enhance our learner experience. However, when evaluating the impact of these changes, we might find that they help one part of the funnel but hurt another. For example, if we launch a free trial offer, the promotion can drive a lot of enrollments and perhaps even initial usage. If for some reason students aren’t completely committed to the program, we will also see an increase in churn. If we only look at the upper funnel impact, we might conclude that the promotion was successful. Given this, we always need to ensure we’re taking an end-to-end perspective to ensure that the change we’re evaluating is truly delivering on customer needs. Here is an overview of Udaciy’s funnel, to give a sense of the stages:
If you use multiple metrics to measure success, ideally you may want to combine this into an Overall Evaluation Criterion (OEC). Some OEC might have challenges that are not meaningful in and of themselves. However, we’ve found that the Expected value has the benefit of a specific meaning. The Expect Value (EV) is an estimate of all the future earnings to be accumulated from a subscription for a given purchase. It is used to measure the performance of acquisition strategies and to provide insights into how much should be spent on customer acquisition. Moreover, we find that having a strong understanding of the relation between Cost per Acquisition (CPA) and EV at the customer level allows us to understand which customer acquisition channel is not profitable or profitable enough and help steer customer acquisition towards the right customer profiles.
Methodology
In this section, we’ll demonstrate how we produce the Expected Value (EV) metric for Udacity enrollment, and use methodologies that you can apply to your dataset as well.
Modeling Approach
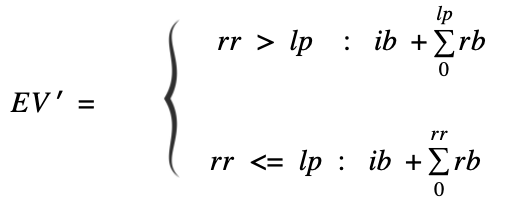
Fundamentally, EV is calculated by summing the amount of the bookings for a single subscription. In our use cases, this total bookings amount is gathered by summing the initial bookings (ib) amount with each recurring payment (rb) made in a subscription. The number of recurring payments is represented using the term (rr):

If we always knew the number of recurring payments that a subscriber will make, then we could perfectly forecast our EV for each subscription. Thus, using this equation, we will apply our machine learning solution towards predicting the number of recurring payments and plug the value into the equation above.
One interesting phenomenon we see is these “endless subscriptions”. While occurring infrequently, these subscribers tend to last well beyond the recommended subscription length for a given nanodegree. Since these long-running subscriptions tend to be outliers, we’ve modified our EV calculation to more accurately predict our bulk subscribers rather than try and fit with the noise.
We accomplished this filtering by introducing a Limit Parameter (lp) which is defined below:
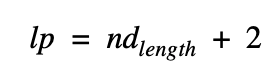
EV is meant to be a leading indicator, which is why our goal is to predict the value for each enrollment. As discussed in the methodology above, we accomplish this by forecasting the matured EV based on our Limit Parameter (lp). This limit parameter was finalized as +2 months after optimizing the modeling error and the total value captured. This tradeoff can be seen in the chart below. Each data point in this figure represents a model with varying limit parameters and varying prediction values. We found setting the limit parameter to +2 months balances the value captured while minimizing the total model error.
The nd_length parameter is the assumed time (in months) that a given nanodegree takes to complete. Our limit parameter adds 2 months to this nd_length as a completion time buffer before we consider our EV to “mature”. We can now calculate our matured EV using the modified equation below:
Now that we’ve established a quantitative response (EV’) we can try various methods predicting this target variable
Model
After experimenting with a few different modeling techniques, our chosen model was an XGBoost Regression model. This nonlinear model was found to outperform some of the other challenge models. Some of the other challenge models include a Linear Regressor and a Random Forest Baseline model.
In the development process, the model could have been represented as either a regression model or a multiclass classifier. After running a few experiments, the regression model target outperformed the multiclass target variable.
During experimenting with different modeling algorithms, our data was split amongst a time-series fashion. While training our data, we explicitly only looked at matured subscriptions so that ongoing subscriptions were not part of our training data. A time-series split between our training and validation data. We ran our experiments this way in order to ensure that data was trained in the future in order to make predictions in the past. This method also represents our production model where we continue to use prior training data to make predictions in the future.
In order to help prevent model drift, this regression learner is constantly being re-trained. Each time a retraining job occurs, Our Regressor uses the most up-to-date set of subscriptions that have ended and forecasts the EV with these updated models.
Monitoring and Evaluation
Having a model in production is key, but monitoring its performance in production is important. In order to prevent this model from experiencing performance drift, the data team uses a set of tools to keep an eye on the model as new predictions are made.
We have been using BigEye as our monitoring tool, the tool monitors our key input features in order to make sure our data sources are performing as expected. We also have some trend monitoring on our EV predictions. When these thresholds fall outside a normal range, our tools send us an alert, so that we can go look into the issue.
The table below shows three active metrics looking at the average prediction value as well as the input features to the model. Some of these features look to ensure the input data is structured the proper way. Other metrics use Bollinger bands to alert us of a degradation issue occurring over time. The customization of these input features makes this tool ideal for model monitoring.
Additionally, we have a series of dashboards used to monitor subscription performance. Here we can look at the true value and the predicted results after they occur. With this, we’re able to determine how well our monitor truly performs in the field by taking a look backward at our predicted subscriptions. The figure below shows one of these views:
Applications
The Expect Value (EV) is an estimate of all the future earnings to be accumulated from a subscription for a given purchase. But our teams also use it as a metric to evaluate trends in our student success. In the chart below, we can see that there is a positive relationship between EV and student outcomes — defined as a student obtaining a skill or receiving a nanodegree.
It’s also used by our Marketing teams to measure the performance of acquisition strategies and to provide insights into how much should be spent on customer acquisition. As mentioned before, EV directly impacts and determines the amount that should be spent on consumer acquisition. It would not be a good business model if our Cost per Acquisition (CPA) were higher than our EV. Getting a good grasp of the relation between CPA and EV at the customer level allows us to understand which customer acquisition channel is not performing and help steer customer acquisition towards the right customer profiles.
Conclusion
In this article, we’ve provided context on why subscription expected value is a key metric to track for Udacity. We also walked through the formula and how we went about creating a machine learning model to forecast all new subscriptions. Finally, we discussed additional applications for EV, including product and marketing-level predictions. Please leave a comment and let us if you found our work interesting!